Satisfaction Indexes
Introduction
When using OMBEA smiley questions to understand satisfaction you can expect a lot of feedback. While you can see how many people chose each emoji, the real power of a smiley question lies in something called its ‘index’. This is a single number that OMBEA Insights calculates from the results. The index represents the balanced total of all your results.
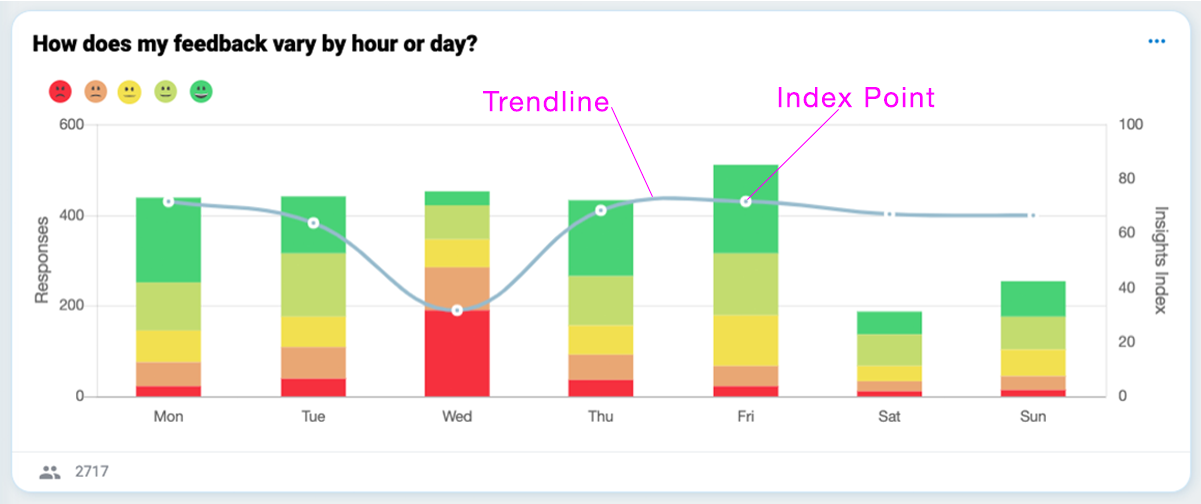
The image below shows a typical chart with a Net Promoter Score Index overlaid.
OMBEA offers four index types:
- Net Promoter Score (NPS).
- Customer Effort Score (CES).
- Customer Satisfaction (CSAT).
- OMBEA Insights Index.
How to choose the right index for your scenario
Net Promoter Score (NPS)
- NPS measures the likelihood that somebody will recommend you to others.
- When responding to NPS, your customer typically considers all factors that affected their experience, across all touchpoints.
- An NPS question follows the form: How likely are you to recommend xxx?
- The index ranges from -100 to +100.
Customer Effort Score (CES)
- CES measures how easy your customer found it to do something.
- When responding to CES, your customer typically considers a narrow range of touchpoints.
- A CES question follows the form: How easy was it for you to xxx?
- The index ranges from 0 to 5.
Customer Satisfaction (CSAT)
- CSAT measures your customer’s immediate or short-term sentiment.
- When responding to CES, your customer typically considers a single interaction in the present moment.
- A CSAT question follows the form: How satisfied were you with xxx today?
- The index ranges from 0 to 100.
OMBEA Insights Index
- This is the default index.
- You should use this index when none of the other choices fit your scenario.
- The Insights Index ranges from 0 to 100.
How the indices are calculated
Net Promoter Score = Percentage of Promoters - Percentage of Detractors
Promoters and Detractors are defined as follows:
- Dark green votes are considered Promoters.
- Light red, dark red, and yellow votes are considered Detractors.
- Light green votes are considered Neutral.
Customer Effort Score = Total sum of responses ÷ Number of responses
When calculating the ‘total sum of responses’:
Each dark green response is worth 5.
Each light green response is worth 4.
Each yellow response is worth 3.
Each light red response is worth 2.
Each dark red response is worth 1.
Customer Satisfaction = (Total of positive responses ÷ Total responses) x 100
- Dark green votes are counted as positive responses.
- Light green votes are counted as positive responses.
- No other responses contribute to the ‘positive’ count.
Insights Index = Total Score ÷ Total number of responses
The total score is calculated as follows:
- Each dark green vote is worth 100.
- Each light green vote is worth 75.
- Each yellow vote is worth 50.
- Each light red vote is worth 25.
- Each dark red vote is worth 0.